Ethereum has been the top player for a long time. The coin has given positive results to the traders and thus holds high market value. Last year, ETH coin’s performance was marked pretty well. Thus, the current year was expected to break records.
The year started with a sluggish movement, yet the chances of the surge were high. Due to the pandemic, the situation took a wild turn, yet it has recently improved substantially. The price touched $448 and reshuffled 90-days high. The moderate correction might take over for a few days.
Ethereum Price Analysis
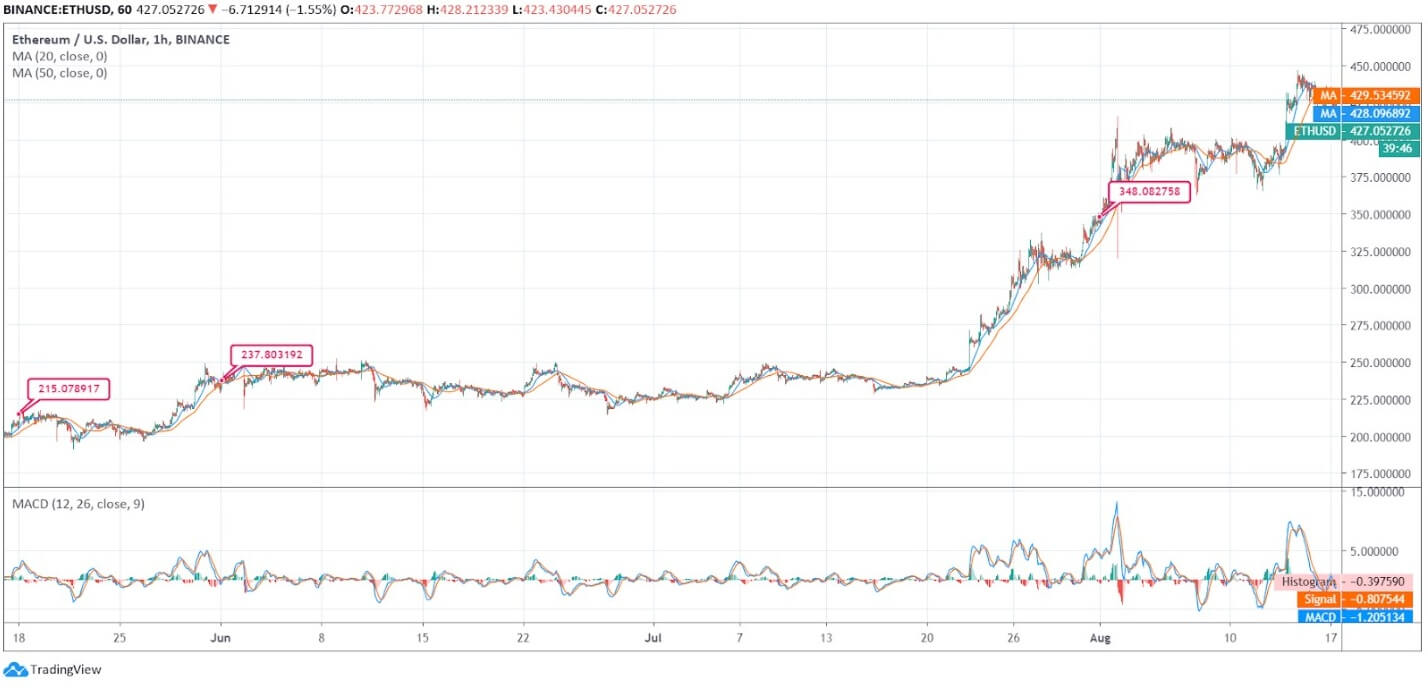
The cryptocurrency is reflecting a steady surge on the quarterly chart. The Ethereum price was at $215 on May 18. The improvement took a substantial jump after July 20.
On May 18, the currency was trading around $215, and it remained intact till May 29. Before closing the month, the ETH price escalated to $237.
Since the first week of June, Ethereum price was spotted trading around $237. The price hovered around the same level for the next few days. Later, the coin reflected a spike but managed to remain at the same level. The month closed around $225.
In July, the ETH price surged to $250 & continued the escalation and touched $348. The surge marked a remarkable closing. In the ongoing month, the coin was caught by the sluggish momentum and remained intact till August 10. With a minor plunge to $375, Ethereum spiked again, and this time, the price counter was at $448.
The daily moving averages of 20 & 50 days are at $428.09 & $429.53, respectively. The bearish crossover is indicating a minor plunge in the short-term period.
The MACD chart is also indicating a similar rush. The upcoming period might consist of regression. The current price of Ethereum is almost near the pivotal point as per the technical counters. The improvement in the price seems doubtful for the intraday traders.


